Infographic Storytelling Short Course
Course description
Course overview
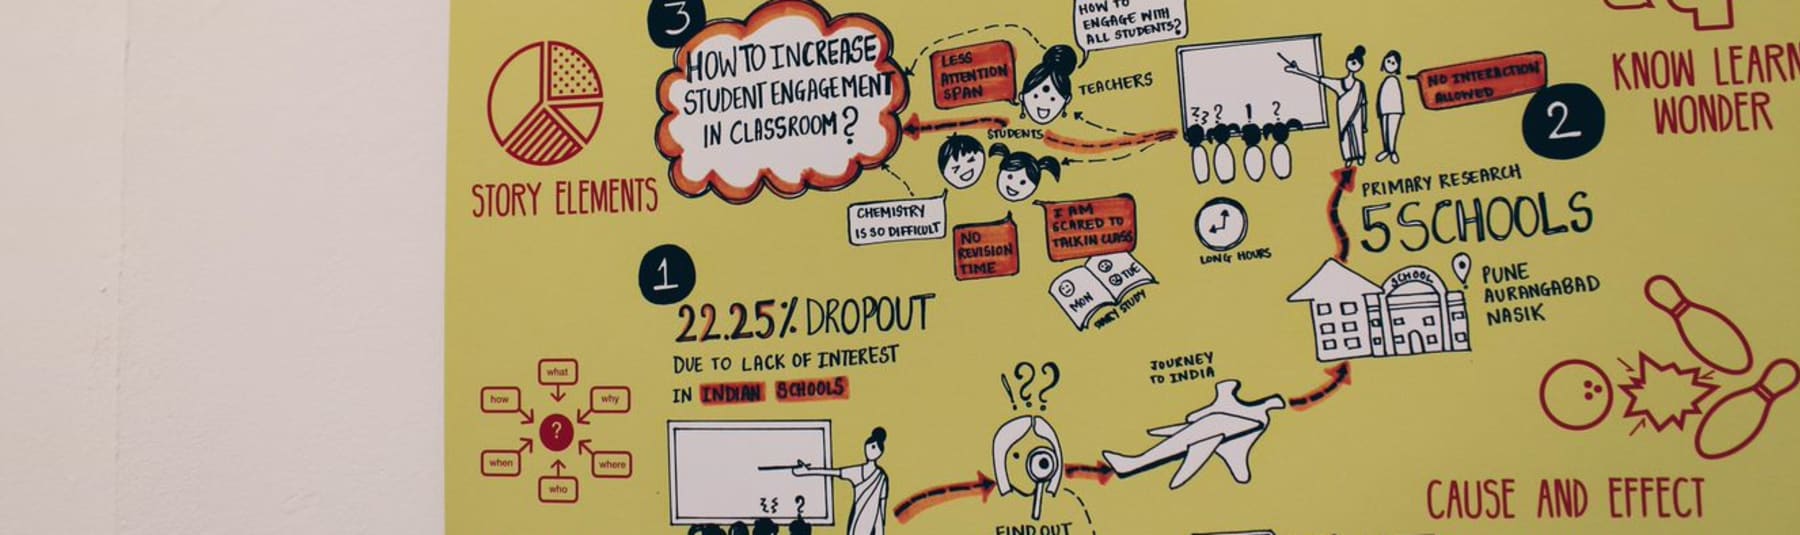
Whether you are working on a professional presentation or a personal project, communicating your findings is often faster and more compelling with an infographic. This introductory course offers an overview of the information design process - how to understand the dataset, brainstorm different angles the data or narrative may allow, frame the story in visual form and tailor it to your audience to maximise the impact of your design.
This course is taught through tutor-guided workshops with some short presentations. You will look at and discuss several examples of infographic storytelling from posters to animations. You will then take part in hands-on tasks to apply the principles and learning covered in the introductory elements, and discuss the work completed as a group, refine and develop it collaboratively.
This is not a software/technical course, so after its completion you may want to take a course in digital software design to bring your ideas to life.
Who this course is for
This beginner course is suitable for anyone working with information for policy, business of campaigns or be responsible for commissioning information design work. This course could be of interest to designers who want to establish fundamental knowledge and experience of information design, but they should be aware that this is an introductory-level session.
Key information
Topics covered
- Key principles of information design
- Narrative and storytelling
- Framing data or narrative for the target audience
- Data visualisation
- Maximising design
Learning outcomes
- Understand the creative journey that turns a raw set of data into a compelling infographic
- Have a knowledge of the editorial process associated with information design
- Have gained an insight into the fundamental principles of designing an inspiring and stimulating infographic story and some experience of the practical application of these principles
- Digital badge and certificate of attendance
Materials
- Note pad or note paper (have access to about 10 sheets of A4 white printer)
- Pencil or pen
- Coloured pencils (optional)
- Access to the internet
Tutor
Jola Piesakowska
Jola Piesakowska is a visual story teller with a strong understanding of how to make sense of data in a visually attractive form which explains and engages. She is a senior trainer with the Thomson Foundation has included running data visualisation workshops in the Middle East and London.
Jola has more than 25 years experience working as a creative media director starting initially with news and current affairs, broadcast media on the UK's leading television channels BBC and ITV before leading PR communications creative teams.
Currently she is the Executive Creative Director of Salt and Pepper Productions, a lifestyle and Fast Moving Consumer Goods (FMCG) marketing and communications agency.
Her previous roles have included: Account Director for Premier Communications, an award -winning dedicated creative communications agency providing 360 degree marketing and PR services to the entertainment, arts and culture industries and Creative Director for the on-line, documentary and feature film post production house Molinare.
She is a blogger and social media campaigner influencing and addressing the interests and needs of the 50+ market.
Book a course
Loading